Easy to use business intelligence. No more spreadsheets. No more guesswork.
Introduction
Overview:
Caarmo connects to existing company’s data and analyzes business performance. Their analytics engine identifies where business unlocks are hidden. Business owners can choose the actions that will lead to their preferred financial outcomes.
Methodology
Objectives:
To enhance the functionality and performance of Caarmo by building a robust ETL pipeline that seamlessly transfers data from their MongoDB database into Google BigQuery. This integration aims to connect and unify data across the company’s ecosystem, enabling comprehensive analysis and strategic planning. By leveraging PowerBI, we aim to provide insightful dashboards that deliver valuable metrics and visualizations, empowering Caarmo to optimize operations, drive sales growth, enhance marketing effectiveness, and achieve their business objectives through data-driven decision-making.
Tools & Technologies:
Data Sources :
GeoSpatial Data in Real Time : MongoDB Database
Operations Data Sources : PostGre SQL Database of the Company
Other Data Sources : Google Spreadsheets, CSV files
Data Connector :
Stitch
Data Transformation :
DBT
SQL , Javascript and YAML
Data Visualization :
PowerBI
Processes:
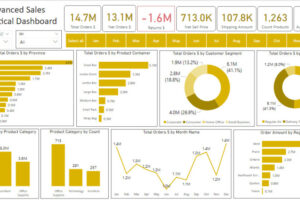
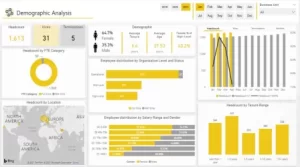
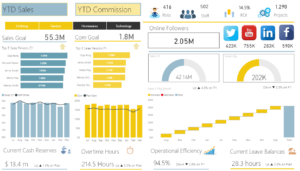
To meet Caarmo’s needs, we began by setting up Stitch as the ETL tool to efficiently transfer data from the MongoDB database into Google BigQuery. Additionally, we connected their PostgreSQL company database to BigQuery to consolidate all relevant data. Using DBT, we performed data transformations, combining and refining the data to build robust data models. We then utilized PowerBI to create comprehensive dashboards, highlighting key metrics and insights. These dashboards were shared across the organization through a centralized PowerBI workspace, ensuring that all stakeholders had access to up-to-date, actionable information. This process facilitated seamless data integration, transformation, and visualization, empowering Caarmo to make data-driven decisions and drive business growth.
Results
Outcomes:
we will assist you in any issue and conflict
Lorem ipsum dolor sit amet, conetur adiping elit Lorem ipsum dolor sit amet, consectetur adipiscing elit.