DataActs

iconicc-powerbi-case-study

IconicC

Converting data into insights

Introduction

Overview:

IconicC provides comprehensive data analytics services by connecting to existing company data and analyzing business performance. Their advanced analytics engine uncovers hidden opportunities and potential unlocks within the business. Business owners can then choose targeted actions to achieve their desired financial outcomes.

iconicc

Objectives:

To enhance the services offered by IconicC, our objective was to build comprehensive PowerBI dashboards for their clients. This involved initially setting up robust ETL pipelines to transfer data into data warehouses, and then utilizing tools like dbt to combine data from various sources. By leveraging PowerBI, we aimed to provide insightful dashboards that deliver valuable metrics and visualizations, empowering IconicC’s clients to optimize operations, drive growth, enhance marketing effectiveness, and achieve their business objectives through data-driven decision-making.

Methodology

Tools & Technologies:

Data Sources :  

  1. Marketing Data Sources : Meta Ads, Google Ads, Bing Ads, Youtub
  2. Operations Data Sources : Hubspot , Samcart , Shopify , Google Sheets, Company’s data in cloud and behavioral data in tools like Amplitude.
  3. Other Data Sources : Typerform, Google Search Console, Google Analytics

Data Connector : 

  1. Keboola & Fivetran

Data Transformation : 

  1. DBT & Dataform (Google Cloud PlatformTool)
  2. SQL , Javascript and YAML

Data Visualization :

  1. PowerBI

Processes:

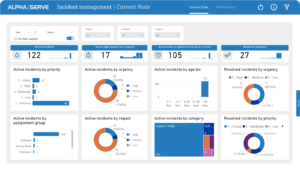
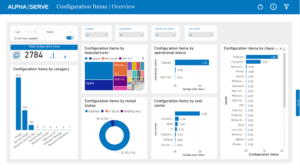
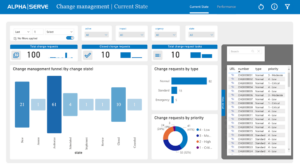
To meet the diverse needs of IconicC’s clients, we began by setting up ETL pipelines using various tools to transfer data into data warehouses such as Snowflake, BigQuery, and RedShift. We then utilized data transformation tools like dbt and Dataform to combine and refine the data, ensuring consistency and accuracy across different sources. Following the data preparation, we developed comprehensive PowerBI dashboards, highlighting key metrics and insights tailored to each client’s specific requirements. These dashboards were shared with clients through a centralized PowerBI workspace, providing real-time access to actionable information. This process enabled IconicC’s clients to make informed, data-driven decisions, driving operational optimization, growth, and enhanced marketing effectiveness.

Results

Outcomes:

we will assist you in any issue and conflict

Lorem ipsum dolor sit amet, conetur adiping elit Lorem ipsum dolor sit amet, consectetur adipiscing elit.
  1. Robust Data Architecture
  2. BI Dashboards for Marketing Team
  3. BI Dashboards for Sales Team
  4. BI Dashboards for Business Stakeholders
  5. Automation in Data Flow

Data Visuals:

iconicc1
iconicc2
iconicc3

Have a project in mind? Let’s talk.